Data as Mutable Mobiles

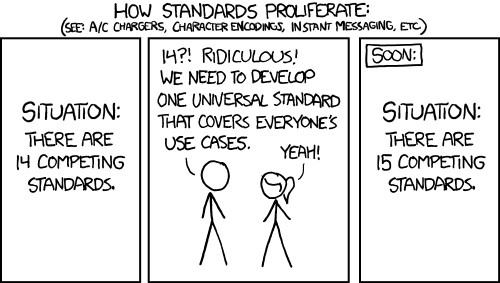
How Standards Proliferate
(c) Randall Monroe https://xkcd.com/927/ (CC-BY-NC)

As archaeologists, we frequently celebrate the diversity and messiness of archaeological data: its literal fragmentary nature, inevitable incompleteness, variable recovery and capture, multiple temporalities, and so on. However, the tools and technologies that we have developed to use and reuse that data do their best to disguise or remove that messiness. Most of the tools and technologies that we employ in the recording, location, analysis, and reuse of our data generally try to reduce its complexity. Of course, there is nothing new in this – by definition, we always tend to simplify in order to make data analysable. However, those technical structures assume that data are static things, whereas they are in reality highly volatile as they move from their initial creation through to subsequent reuse, and as we select elements from the data to address the particular research question in hand. This data instability is something we often lose sight of.

The illusion of data as a fixed, stable resource is a commonplace – or, if not specifically acknowledged, we often treat data as if this were the case. In that sense, we subscribe to Latour’s perspective of data as “immutable mobiles” (Latour 1986; see also Leonelli 2020, 6). Data travels, but it is not essentially changed by those travels. For instance, books are immutable mobiles, their immutability acquired through the printing of multiple identical copies, their mobility through their portability and the availability of copies etc. (Latour 1986, 11). The immutability of data is seen to give it its evidential status, while its mobility enables it to be taken and reused by others elsewhere. This perspective underlies, implicitly at least, much of our approach to digital archaeological data and underpins the data infrastructures that we have created over the years.

Continue reading

Productive Friction

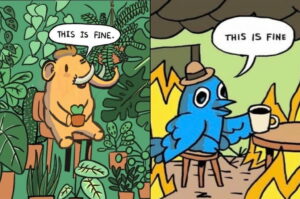
Mastodon vs Twitter meme
Mastodon vs Twitter meme (via https://mastodon.nz/@TheAtheistAlien/109331847144353101)

Right now, the great #TwitterMigration to Mastodon is in full flood. The initial trickle of migrants when Elon Musk first indicated he was going to acquire Twitter surged when he finally followed through, sacked a large proportion of staff and contract workers, turned off various microservices including SMS two-factor authentication (accidentally or otherwise), and announced that Twitter might go bankrupt. Growing numbers of archaeologists opened accounts on Mastodon, and even a specific archaeology-focussed instance (server) was created at archaeo.social by Joe Roe.

Something most Twitter migrants experienced on first encounter with Mastodon was that it worked in a manner that was just different enough from Twitter to be somewhat disconcerting. This was nothing to do with tweets being called ‘toots’ (recently changed to posts following the influx of new users), or retweets being called ‘boosts’, or the absence of a direct equivalent to quote tweets. It had a lot to do with the federated model with its host of different instances serving different communities which meant that the first decision for any new user was which server to sign up with, and many struggled with this after the centralised models of Twitter (and Facebook, Instagram etc.) though older hands welcomed it as a reminder of how the internet used to be. It also had a lot to do with the feeds (be they Home, Local, or Federated) no longer being determined by algorithms that automatically promoted tweets but simply presenting posts in reverse chronological order. And it had to do with anti-harassment features that meant you could only find people on Mastodon if you knew their username and server, and the inability to search text other than hashtags. These were deliberately built into Mastodon, together with other, perhaps more obviously, useful features like Content Warnings on text and Sensitive Content on images, and simple alt-text handling for images.

Continue reading

Data Detachment

‘Data detachment’ via Craiyon

A couple of interesting but unrelated articles around the subject of humanities digital data recently appeared: a guest post in The Scholarly Kitchen by Chris Houghton on data and digital humanities, and an Aeon essay by Claire Lemercier and Clair Zalc on historical data analysis.

Houghton’s article emphasises the benefits of mass digitisation and large-scale analysis in the context of the increasing availability of digital data resources provided through digital archives and others. According to Houghton, “The more databases and sources available to the scholar, the more power they will have to ask new questions, discover previously unknown trends, or simply strengthen an argument by adding more proof.” (Houghton 2022). The challenge he highlights is that although digital archives increasingly provide access to large bodies of data, the work entailed in exploring, refining, checking, and cleaning the data for subsequent analysis can be considerable.

An academic who runs a large digital humanities research group explained to me recently, “You can spend 80 percent of your time curating and cleaning the data, and another 80 percent of your time creating exploratory tools to understand it.” … the more data sources and data formats there are, the more complex this process becomes. (Houghton 2022).

Continue reading

HARKing to Big Data?

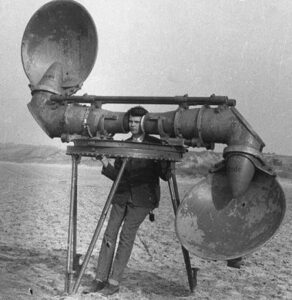
Aircraft Detection Before Radar
A 1920s aircraft detector

Big Data has been described as revolutionary new scientific paradigm, one in which data-intensive approaches supersede more traditional scientific hypothesis testing. Conventional scientific practice entails the development of a research design with one or more falsifiable theories, followed by the collection of data which allows those theories to be tested and confirmed or rejected. In a Big Data world, the relationship between theory and data is reversed: data are collected first, and hypotheses arise from the subsequent analysis of that data (e.g., Smith and Cordes 2020, 102-3). Lohr described this as “listening to the data” to find correlations that appear to be linked to real world behaviours (2015, 104). Classically this is associated with Anderson’s (in)famous declaration of the “end of theory”:

With enough data, the numbers speak for themselves … Correlation supersedes causation, and science can advance even without coherent models, unified theories, or really any mechanistic explanation at all. (Anderson 2008).

Such an approach to investigation has traditionally been seen as questionable scientific practice, since patterns will always be found in even the most random data, if there’s enough data and powerful enough computers to process it.

Continue reading

Mining the Grey

Text mining icon
Text mining icon by Julie McMurray (via Pixabay)

Archaeological grey literature reports were primarily a response to the explosion of archaeological work from the 1970s (e.g. Thomas 1991) which generated a backlog which quickly outstripped the capacity of archaeologists, funders, and publishers to create traditional outputs, and it became accepted that the vast majority of fieldwork undertaken would never be published in any form other than as a client report or summary format. This in turn (and especially in academic circles) frequently raised concerns over the quality of the reports, as well as their accessibility: indeed, Cunliffe suggested that some reports were barely worth the paper they were printed on (cited in Ford 2010, 827). Elsewhere, it was argued that the schematisation of reports could make it easier to hide shortcomings and lead to lower standards (e.g. Andersson et al. 2010, 23). On the other hand, it was increasingly recognised that such reports had become the essential building blocks for archaeological knowledge to the extent that labelling them ‘grey’ was something of a misnomer (e.g. Evans 2015, sec 5), and the majority of archaeological interventions across Europe were being carried out within the framework of development-led archaeology rather than through the much smaller number of more traditional research excavations (e.g. Beck 2022, 3).

Continue reading

Grey Data

Row of books with Informed on the spinesIn recent years, digital access to unpublished archaeological reports (so-called ‘grey literature’) has become increasingly transformational in archaeological practice. Besides being important as a reference source for new archaeological investigations including pre-development assessments (the origin of many of the grey literature reports themselves), they also provide a resource for regional and national synthetic studies, and for automated data mining to extract information about periods of sites, locations of sites, types of evidence, and so on. Despite this, archaeological grey literature itself has not yet been closely evaluated as a resource for the creation of new archaeological knowledge. Can the data embedded within the reports (‘grey data’) be re-used in full knowledge of their origination, their strategies of recovery, the procedures applied, and the constraints experienced? Can grey data be securely repurposed, and if not, what measures need to be taken to ensure that it can be reliably reused?

Continue reading

Data in a Crisis

One of the features of the world-wide COVID-19 pandemic over the past eighteen months has been the significance of the role of data and associated predictive data modelling which have governed public policy. At the same time, we have inevitably seen the spread of misinformation (as in false or inaccurate information that is believed to be true) and disinformation (information that is known to be false but is nevertheless spread deliberately), stimulating an infodemic alongside the pandemic. The ability to distinguish between information that can be trusted and information which can’t is key to managing the pandemic, and failure to do so lies behind many of the surges and waves that we have witnessed and experienced. Distinguishing between information and mis/disinformation can be difficult to do. The problem is all too often fuelled by algorithmic amplification across social media and compounded by the frequent shortage of solid, reliable, comprehensive, and unambiguous data, and leads to expert opinions being couched in cautious terms, dependent on probabilities and degrees of freedom, and frustratingly short on firm, absolute outcomes. Archaeological data is clearly not in the same league as pandemic health data, but it still suffers from conclusions drawn on often weak, always incomplete data and is consequently open to challenge, misinformation, and disinformation.
Continue reading

Data as Flux

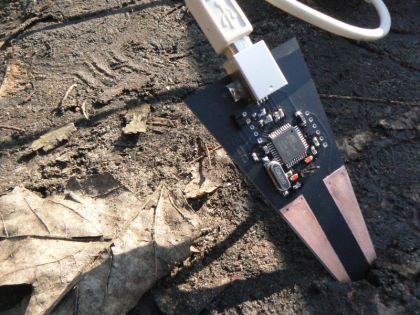
The Earthboot device, by Martin Howse (2013)

Data is tricky stuff. It can appear to be self-evident but equally may be elusive. It can be material yet immaterial, tangible but ephemeral, objective yet biased, precise but inaccurate, detailed but broad-brush. It may be big or small, fast or slow, quantitative or qualitative. It may be easily misrepresented, misconceived, misunderstood, misread, misconstrued, misinterpreted. It can be distorted, altered, mangled, wrangled, and reshaped into something it never originally was according to different purposes and agendas. Data is slippery and perilous, but we often overlook its characteristics and peculiarities in the pursuit of interpretation and – hopefully! – knowledge. Looking over this blog, I’ve written a lot about data over the years. In the process, I’ve undoubtedly repeated myself, quite probably contradicted myself, sometimes confused myself, and that’s before considering any of my more formal publications on the subject! For instance, there’s the question of missing and unknown data, data associations, data metaphors, data reuse, data proxies, big data, and quite a lot more besides on data archiving etc.. Not only does this highlight how fundamental data are, but it perhaps underlines the value of a range of different perspectives about the character and nature of data.

Continue reading

Nothing is Something

The black hole at the centre of Messier 97, via the Event Horizon Telescope (Wikimedia CC-BY)

Shannon Mattern has recently written about mapping nothing: from the ‘here be dragons’ on old maps marking the limits of knowledge and the promise of new discoveries, to the perception of the Amazon rainforest as an unpeopled wilderness until satellite imagery revealed pre-Columbian geoglyphs which had been largely invisible on the ground. In her wide-ranging essay, she makes the point that nothingness is always something: “A map of nothing demonstrates that an experiential nothingness depends upon a robust ecology of somethingness to enable its occurrence” (Mattern 2021). The question, of course, is what that something actually is.

Nothingness is something that has long been an issue in databases. Null is traditionally used to represent something missing. As null is not a value, it is technically and meaningfully distinct from zeros and empty strings which are values and hence indicators of something. Although this seems straightforward, the boundaries begin to blur when some guides to SQL, for instance, define null in terms of both missing and unknown values. After all, if something is missing, then we know we are missing it; if something is unknown, then we don’t know whether or not it was ever something. Indeed, Codd, in his classic book on relational databases argued that null should also indicate why the data is missing, distinguishing between a null that is ‘missing but applicable’, and a null that is ‘missing but inapplicable’ (Codd 1990, 173), but this was never adopted. Consequently, nulls tend to have a bad reputation because of the ways they may variously be used (mostly in error) as representing ‘nothing’, ‘unknown’, ‘value not yet entered’, ‘default value’, etc. in part because of messy implementations in database management systems.

Continue reading

Languages of Representation

Adapted from original by Pete Linforth from Pixabay

Shawn Graham recently pointed me (and a number of colleagues!) to a new paper entitled ‘Computer vision, human senses, and language of art’ by Lev Manovich (2020) in a tweet in which he asked what we made of it … so, challenge accepted!

Lev Manovich is, of course, a professor of computer science and a prolific author, focusing on cultural analytics, artificial intelligence, and media theory, amongst other things. In this particular paper, he proposes that numbers, and their associated analytical methods, offer a new language for describing cultural artefacts. The idea that this is novel may be news to those who have been engaged in quantitative analyses across the humanities since before the introduction of the computer, but aspects of his argument go further than this. The actual context of the paper is as yet unclear since it is online first and not yet assigned to a volume. That said, a number of other open access online first papers in AI & Society seem to address similar themes, so one might imagine it to be a contribution to a collection of digital humanities-related papers concerning images and computer vision.

It’s an interesting paper, not least since – as Manovich says himself (p2) – it presents the perspective of an outside observer writing about the application of technological methods within the humanities. Consequently it can be tempting to grump about how he “doesn’t understand” or “doesn’t appreciate” what is already done within the humanities, but it’s perhaps best to resist that temptation as far as possible.

Continue reading